
 |
Eager Space | Videos by Alpha | Videos by Date | All Video Text | Support | Community | About |
|---|

Launch Vehicle Recover and Reuse Paper
https://www.ulalaunch.com/docs/default-source/supporting-technologies/launch-vehicle-recovery-and-reuse-(aiaa-space-2015).pdf
Business case and spreadsheet post
https://forum.nasaspaceflight.com/index.php?topic=37390.0
Dr. Sowers' comments on a longer reuse thread.
https://forum.nasaspaceflight.com/index.php?topic=37390.msg1470446#msg1470446
For a long time, ULA has been producing PR material that refers to SpaceX and the Falcon 9. This is a second part of a series where we look at the details of one piece of PR material to decide whether it's PR, or whether it's lies.
For this part, we're going to be looking at the famous - or perhaps notorious - ULA paper on launch vehicle recovery and reuse.
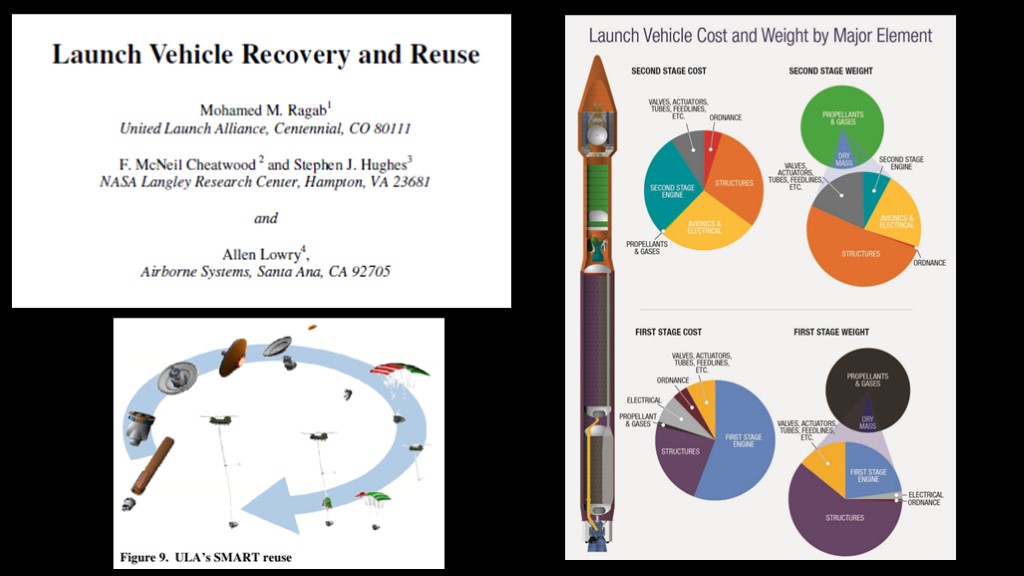
And here's the paper, released in 2015. There is some interesting stuff here; there's a map of ULA's SMART (Sensible Modular Autonomous Return Technology) reuse approach, and more interestingly, this chart that tells us how much the various parts of their rockets cost. If you want to read the whole paper, I've linked to it in the description.
But that's not why you are here. You are here for the graph...
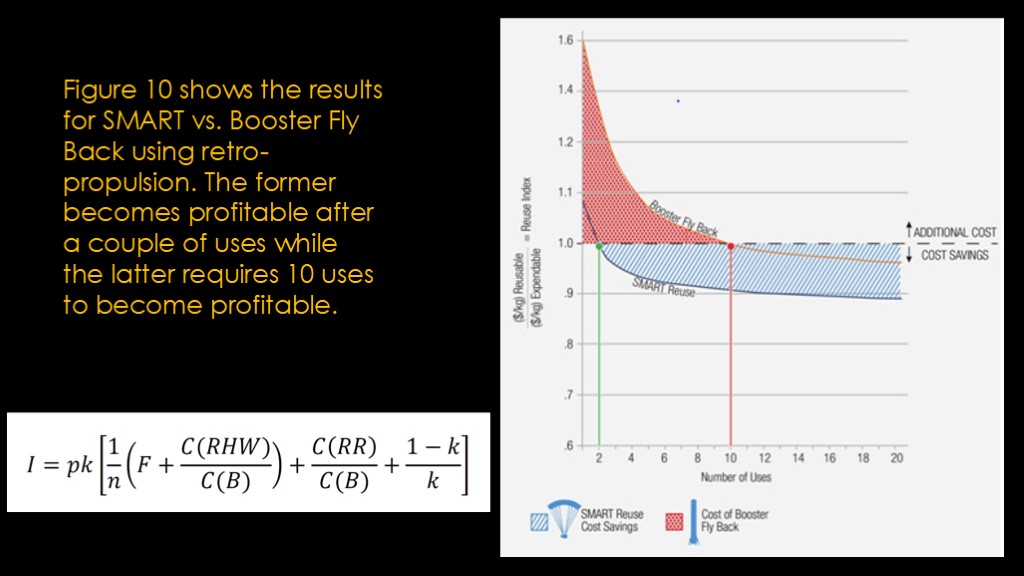
This is the graph, and this is the text that goes along with it (read).
And note that when ULA says "booster fly back", they are talking about drone ship landing, not flying back to the launch site.
They determine the reuse index based upon the cost per kilogram of payload.
The model is based on a fairly complicated equation and contains a few terms that I frankly don't think are very important.
Before we spend more time with it, I want to talk about models in general and then we will look at a simpler reuse model.
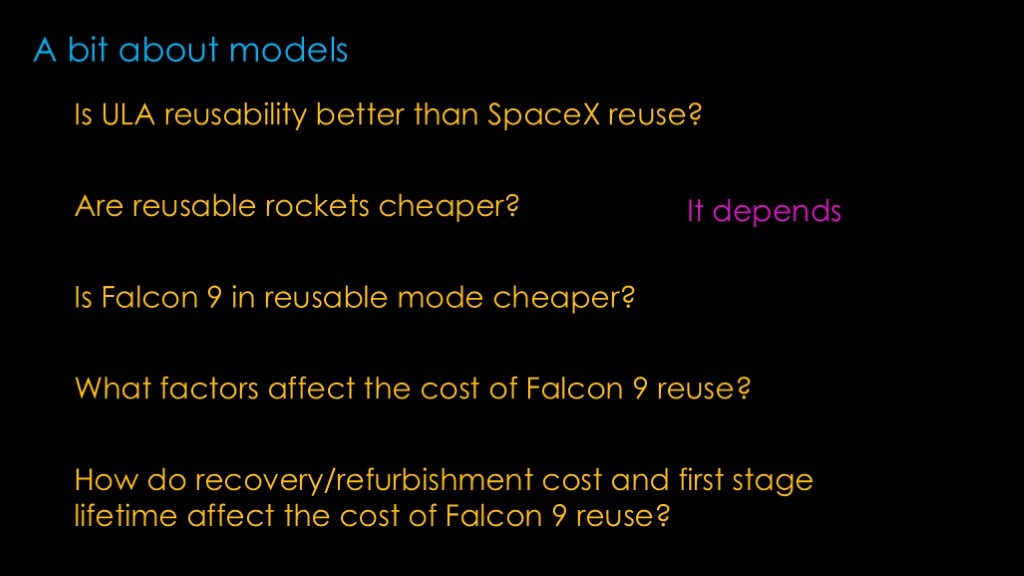
We build models to answer questions.
The question the paper is trying to answer is whether ULA reusability is better than SpaceX reuse. That's a very hard question to answer because SMART reuse was theoretical at the time the paper was published and still remains theoretical in early 2024.
So I'm going to put that question aside and talk about the broader question, are reusable rockets cheaper?
That question is pretty easy to answer, and the answer is "it depends". We can envision cases where reusable rockets would be cheaper and we can envision cases where they would be more expensive. We need a better question.
Is Falcon 9 in reusable mode cheaper?
That's a better question as it allows us to deal with specifics, but its still too simplistic as there's not going to be a simple yes/no answer.
What factors affect the cost of Falcon 9 reuse?
This is an interesting question. There are a obviously a lot of factors, so it would be good to limit them down.
How do recovery/refurbishment cost and first stage lifetime affect the cost of Falcon 9 reuse?
This is good - it's specific enough that we can probably come up with a simple model.
We aren't spacex so we won't have real data, but we can come up with some estimates that will give us a deeper understanding of reuse for the Falcon 9.
The model I'm introducing is wrong in specifics but it's right enough.
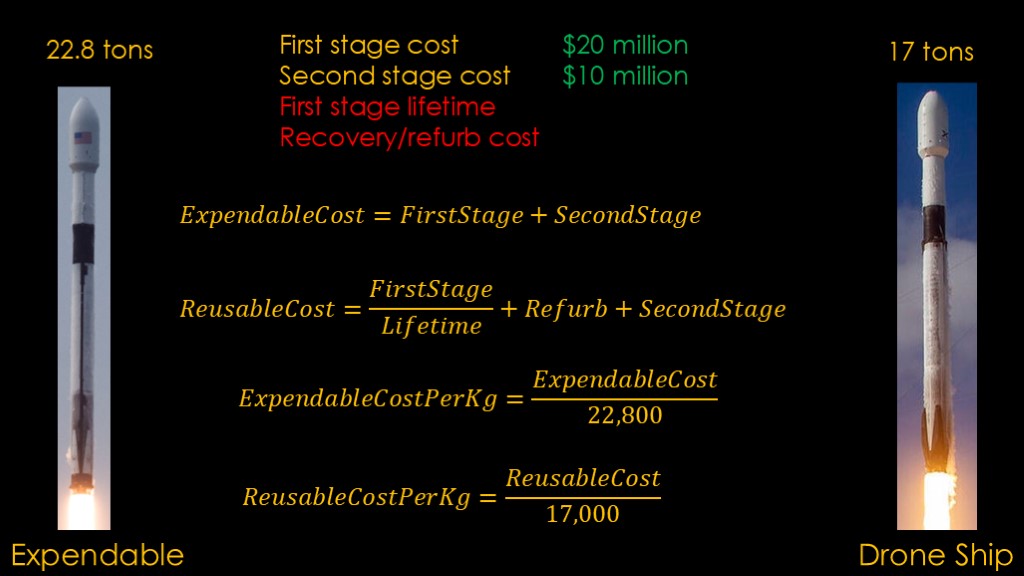
We are going to be comparing Falcon 9 in expendable mode to Falcon 9 with the first stage landing on the drone ship. Space says that Falcon 9 can carry 22.8 tons to low earth orbit in expendable mode, and we've seen it launch 17 tons and land on the drone ship for starlink launches, so those numbers will be decently accurate.
We will assume for the model that the first stage cost is $20 million the second stage cost is $10 million.
We've already identified the two variables we want to look at - the first stage lifetime and the recovery and refurbishment cost. You could use the same model to explore how second stage cost affects things if you wanted.
Our equations are pretty simple - the expendable cost is the cost of the first stage plus the cost of the second stage.
The reusable cost is the cost of the first stage divided by the number of times we expect it to fly plus the recovery/refurb cost plus the second stage cost.
That gives the cost per flight, but we haven't accounted for the difference in payload, so we divide those costs by the payloads to figure out the cost per kilogram.
All of this feeds into a pretty simple Excel spreadsheet which will generate a graph with our two variables.
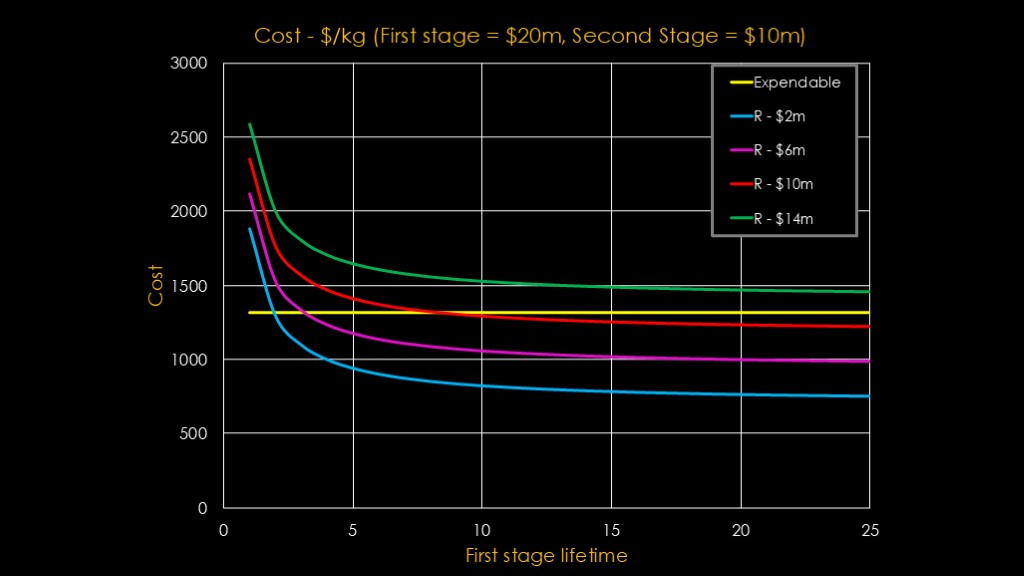
Here's the graph. The horizontal axis is the number of times a first stage flies before it is scrapped. The vertical axis is the cost in dollars per kilogram. The yellow line shows the expendable cost, which of course doesn't vary. Note that I'm talking about cost using a very simple model, so the numbers will be much lower than the price that SpaceX charges.
The different lines are for different recovery and refurbishment costs - the blue line assumes it only costs $2 million, and the green line assumes it costs $14 million.
The green line tells us something interesting right off the bat. We learn that if it costs $14 million for recovery and refurbishment, reuse is not practical - the payload loss is greater than the savings. That's true at $12 million as well.
Looking at the other lines, we can see that recovery cost is the critical factor in whether reuse is practical. If you can get to $6 million it's a lot more interesting than $10 million.
Another interesting thing is that first stage lifetime isn't super important. Once we get to 10 flights, the cost per flight of the stage itself is down to $2 million, and pushing that to 20 flights only reduces that down to $1 million. After ten flights the overall flight cost is dominated by the cost of the second stage and the cost of recovery and refurbishment.
I think this model is a success. The big thing we learned is that reuse depends heavily on the recovery and refurbishment costs. If those are high enough, it doesn't matter how many times you reuse the first stage. And if they are low enough, reuse starts saving you money very quickly.
Let's return the graph from the paper.
(rework)
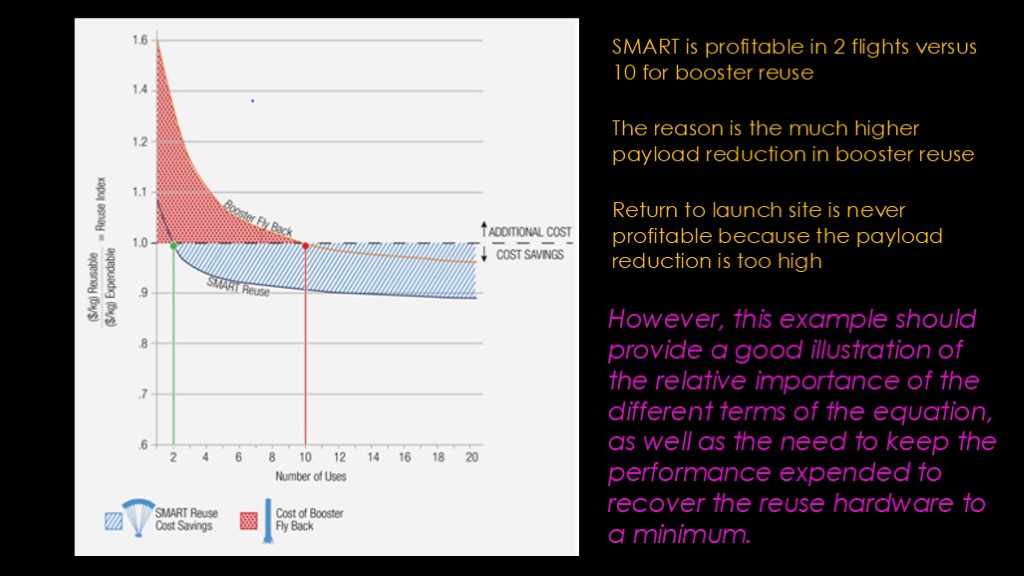
The problem with this graph is that it doesn't tell us anything useful. Like my graph, there's a mathematical model behind it but it only shows us one graph line for each reuse scenario and it doesn't tell us what the underlying assumptions are. As we saw with our model, we can play with the inputs to come up with whatever result we want.
I would therefore rate the utility of this graph as minimal - I can't evaluate what ULA has done to achieve these results and I can't validate whether their assumptions make sense.
ULA makes a number of points in their text.
Smart is profitable in 2 flights versus 10 for booster reuse
The reason is the much higher payload reduction in booster reuse
Return to launch site is never profitable because the payload reduction is too high.
It concludes with the following (read).
This is honestly hilarious. The graph shows the results for a single set of values and the only variable is the number of uses, and therefore it *cannot* show the relative importance of the different terms of the equation since different values of those terms are not explored. I guess it can maybe show that lower performance loss is better than higher performance loss since the SMART curve assumes less and the Falcon 9 assumes more, but that is honestly probably the simplest thing to figure out about reuse.
I feel like this graph was pulled out of a more in-depth research paper, one that addressed my concerns, but this paper is all that was available.
Then this happened.
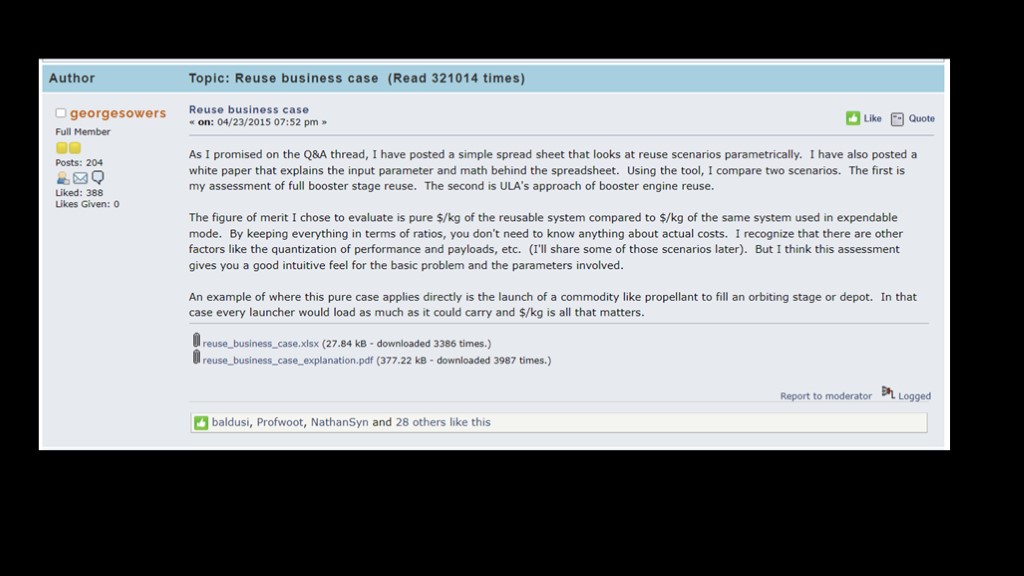
The creator of the model posted on a NASASpaceFlight.com forum thread - I've linked it in the description of the video - and included both an explanation of the business case and an excel model, presumably the one they used to create the data.
This gives us a lot more detail on the model behind the graph.
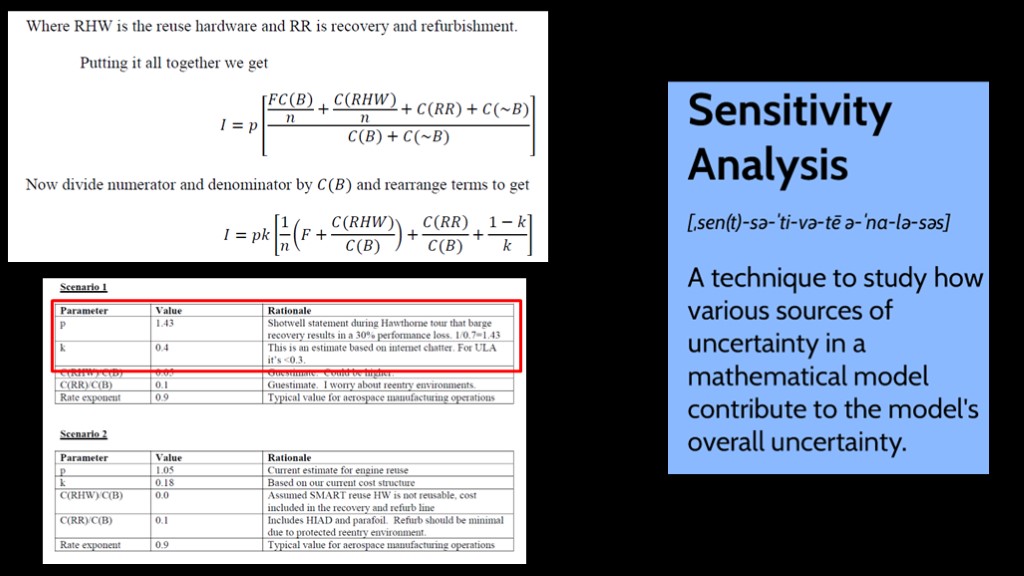
The business case explanation paper gives a lot more detail about the equation they are using in the model, and that is useful.
We also get information about the actual parameter values they used.
All they have for any of the parameters is a single value. I really want to see some sensitivity analysis, where you define a parameter range for each parameter and see how differences in that value change the result, as we did with our model. This is especially important because of the fuzziness of the numbers - I especially like that one is quote "based on internet chatter".
Two parameters seem especially interesting...
This model's p value assumes a 30% penalty with drone ship reusability, but the actual numbers I used in my model suggest it's only 25%.
K in the model is the fraction of the overall hardware cost that is reused. That could easily be a higher fraction.
Maybe the spreadsheet can help...
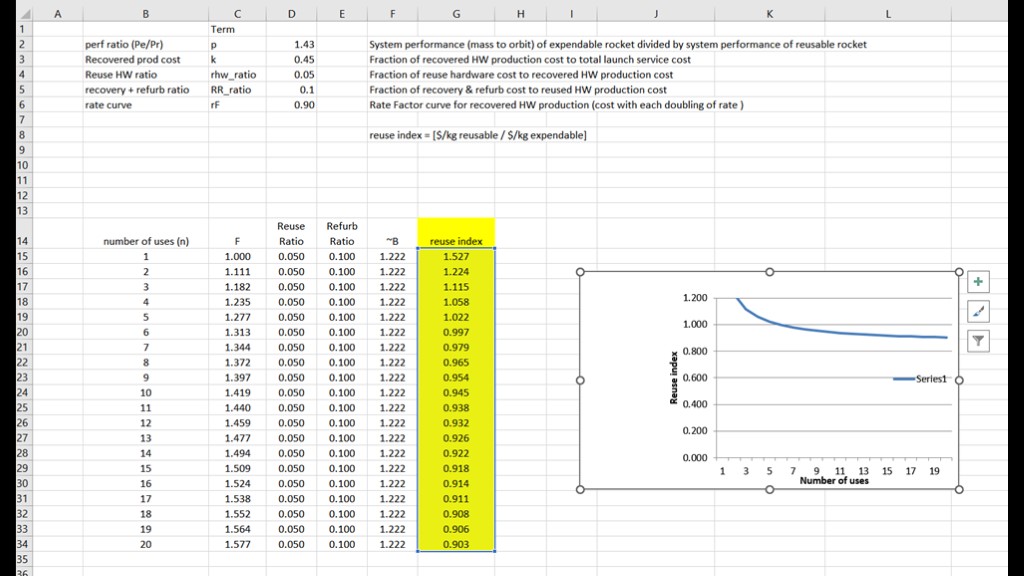
Considering the complexity of the model, I was surprised at how simple the spreadsheet was.
I modified it so we can do sensitivity analysis on the k and p variables.
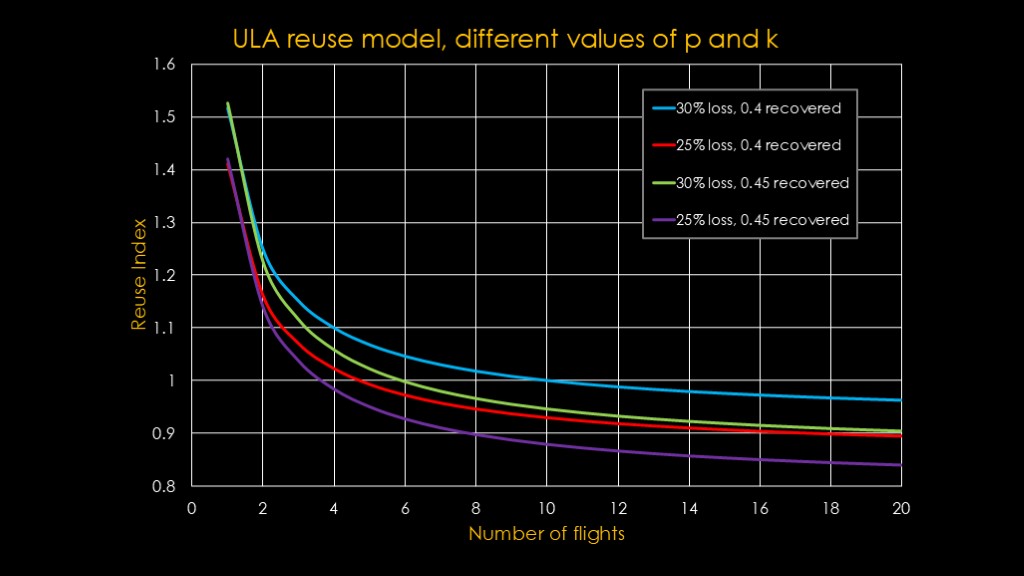
Here's the resulting graph for the Falcon 9 case.
The blue line is the one used in the chart that says that breakeven for reuse is 10 flights. Let's play a bit.
The green line shows the result if you save 45% of the cost of hardware rather that 40%. The pushes the breakeven down to 6 flights.
The red line shows what happens if the payload loss is 25% rather than the 30% used for the blue line. That puts breakeven at 5 flights.
If you make both of those changes, breakeven is at 4 flights.
Not surprisingly, we've found that the model is very sensitive to those values. The 25% payload loss value seems to be a better value than the 30% used, though it's fair to note that the 25% number is on the fully refined block 5 version of Falcon 9 and it took SpaceX years to get there. The recovery fraction change may not have made sense when the paper was written but probably does when fairing recovery is taken into consideration.
It's pretty clearly both the model and the graph were created to tell a story rather that do an analysis.
There's one more thing in the business case paper that I want to cover...
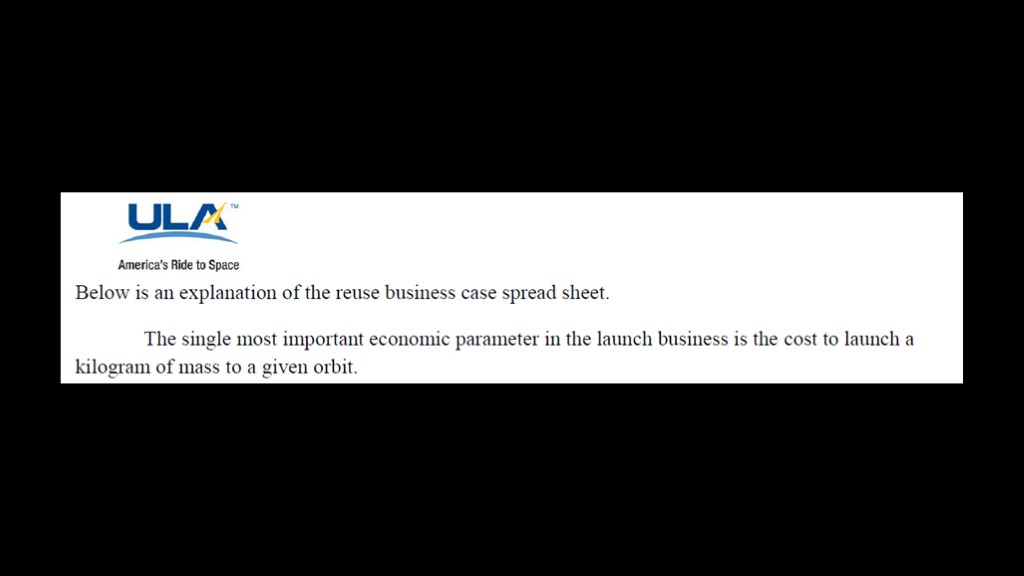
The business justification document says the following at the top.
Read.
Hmm...
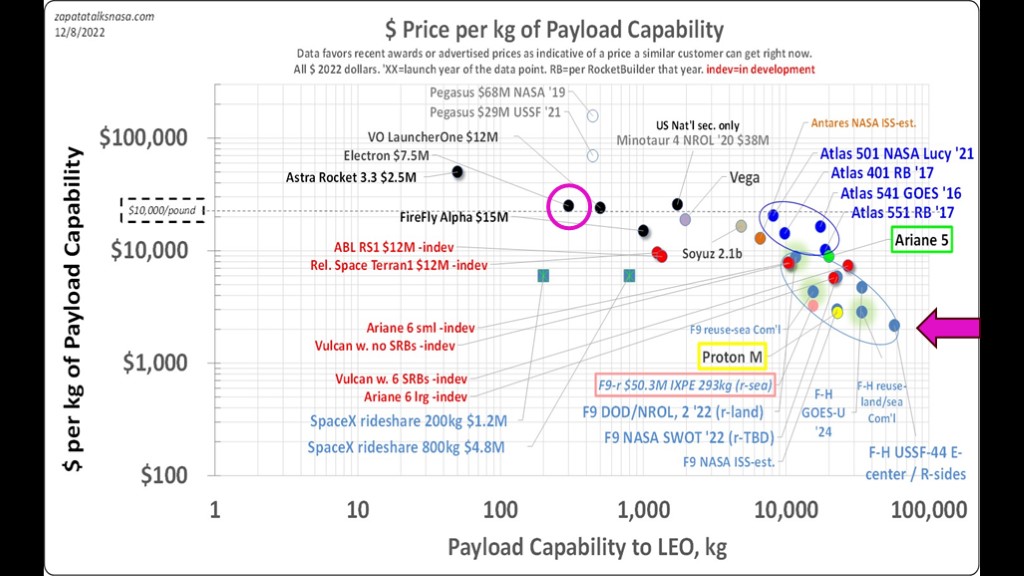
Here's a wonderful chart from Zapata talks nasa that shows cost per kilogram of a bunch of different rockets.
Way over here on the right side we have the Falcon Heavy flying the USSF-44 mission. The cost is a little over $2000 per kilogram, making it the current leader, and since that parameter is the single most important one, that is why everybody flies Falcon Heavy and those Electron flights that you have been watching are just figments of your imagination.
The ULA statement is so obviously not true that I'm wondering who they have proofreading their material.
Consider two payloads
The Gazelle satellite is 110 kilograms in mass and it is destined for a low earth orbit.
The Jupiter 3 communications satellite is 9200 kilograms in mass and needs to go to the higher energy geosynchronous transfer orbit.
It's not surprising that gazelle was launched by the small Rocket Lab Electron and Jupiter 3 required the might of the Falcon Heavy.
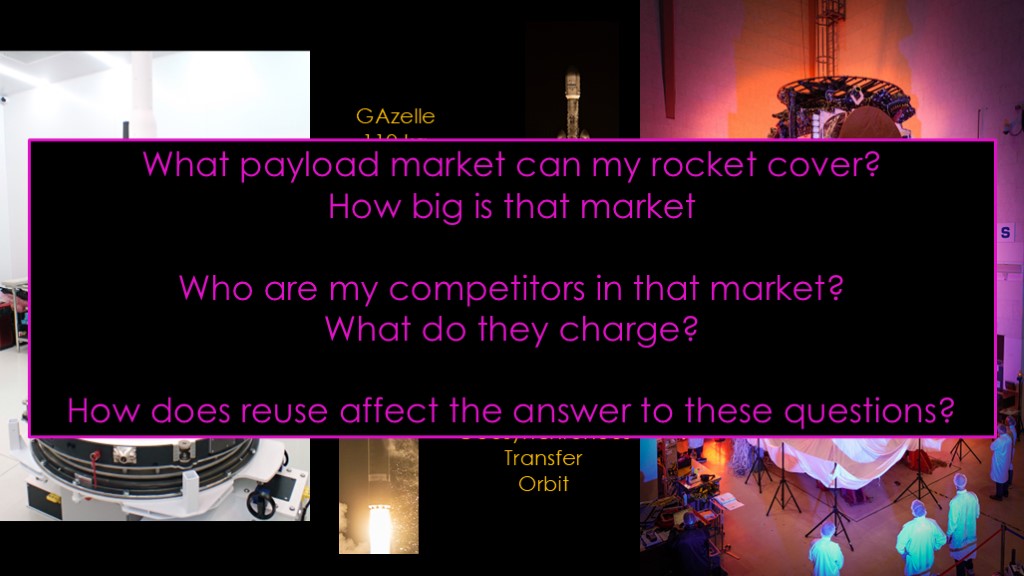
It's not cost per kilogram that matters. What matters is the answer to a few simple questions...
What payload market can my rocket cover?
How big is that market?
Those together define the business opportunity. If the market for my rocket is only 5 flights a year, it's probably not enough to support a company.
Who are my competitors in that market?
What do they charge?
This is about the competition in the market. The market for Rocket Lab's electron isn't that big because they payload is small, but they mostly have the small satellite launch market to themselves.
And then, for the sake of this discussion, how does reuse affect the answer to these questions?
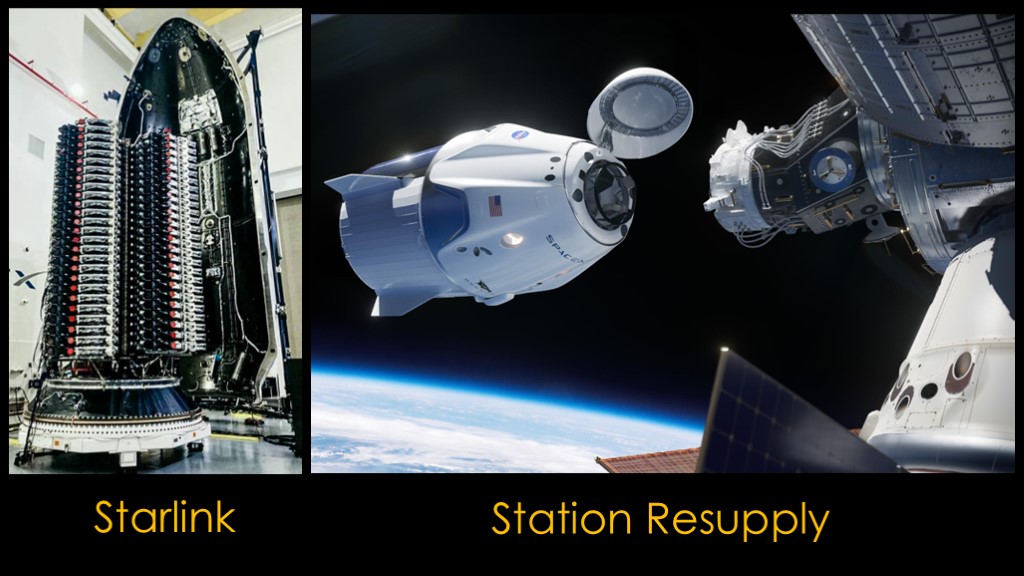
Before we look at a market analysis, I think there are two markets where cost per kilogram is very important.
The first is starlink. For constellation launches, you want to design your satellites so you can fit as many as possible in the fairing and hit the maximum payload to a given orbit.
The second is station resupply. You will want to pack as many supplies as possible into the capsule. The Dragon 2 shown here is volume limited - NASA runs out of space to carry supplies before they run out of payload - but other resupply scenarios might use a bigger vehicle.
Propellant tankers would probably be another example.
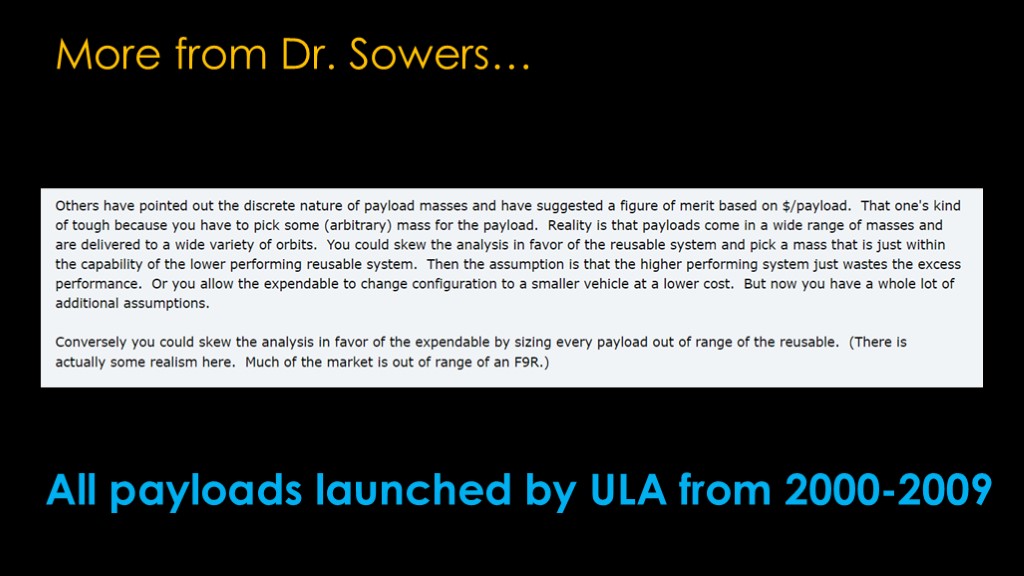
The forum thread yields more comment from Doctor Sowers.
This is getting *so close* to the right way to do analysis. What Dr. Sowers is missing is that you don't need to pick one mass for your analysis. You can pick the spread of payload masses that exist in the market you want to cover.
What matters is how your reusability approach affects the market that you want to cover.
To do an analysis, you need to figure out the market, and that is a lot of work. I'm going to use a subset of market, which is all payloads launched by ULA from 2000-2009.
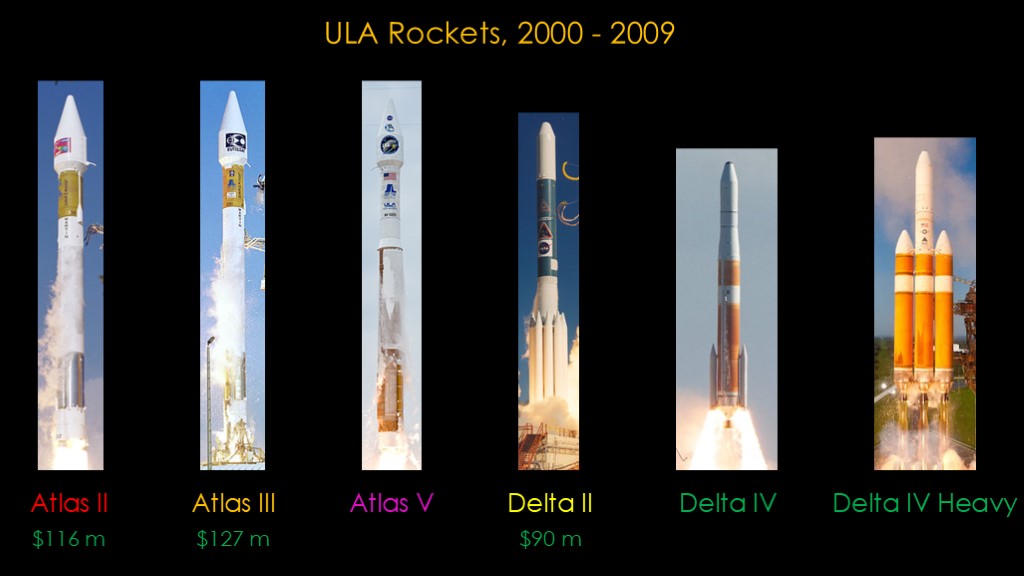
This is complicated because ULA flew 5 different rockets during that decade. There was the atlas II, atlas III, and atlas V, with 10 different variants. The was the Delta II, with 3 basic variants and the delta IV, with another 4 variants. And that's ignoring fairing size differences.
Initially I was going to exclude the Atlas II and III and the Delta II because they weren't actually competitive in payload with Falcon 9, but it turns out that a) they flew a lot of missions and b) they were pricier than I expected.
All numbers are in 2006 dollars adjusted for inflation.
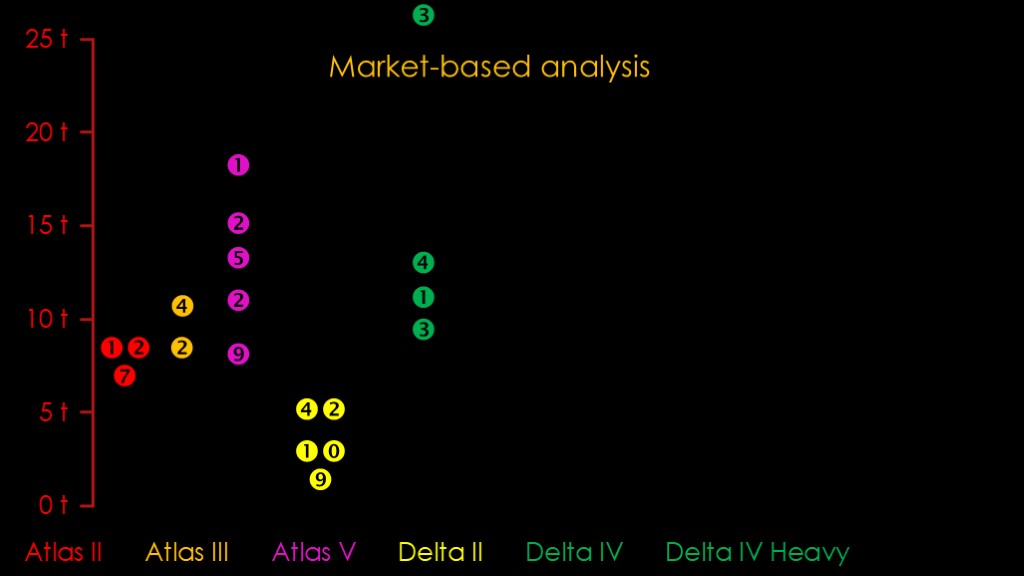
We'll classify all the ULA flights based the maximum payload to low earth orbit of the specific rocket variant. This is an oversimplification but the only good way I came up with to compare the flights. I'll do a bit of an adjustment later to correct for an error that this may introduce.
The number of flights for each variant is put in a vertical position that shows what that variant's payload to low earth orbit is.
For the atlas 2, there were 7 of the IIA variant and 12 of the IIAS variant.
For atlas 3, there were two of the IIIA and 4 of the beefier IIIB variant
For the atlas v, there were 9 launches of the 501 variant with no boosters, 2 with one booster, 5 with two boosters, 2 with three boosters, and 1 with 5 boosters.
For delta II, there were 9 of the 7300 series, 10 of the 7400 series, and an impressive 42 of the 7900 series.
And finally, for the delta IV, there were three flights of the M variant, one flight of the M+(5,4) variant, and four flights of the M+(4,2) version. In addition, there were three delta IV heavy flights.
That is a lot of flights, 116 by my count. This a decent analysis of the payloads that ULA flew in that decade; it ignores the missions flown by other launchers.
What sort of reuse would be possible if Falcon 9 launched these payloads?
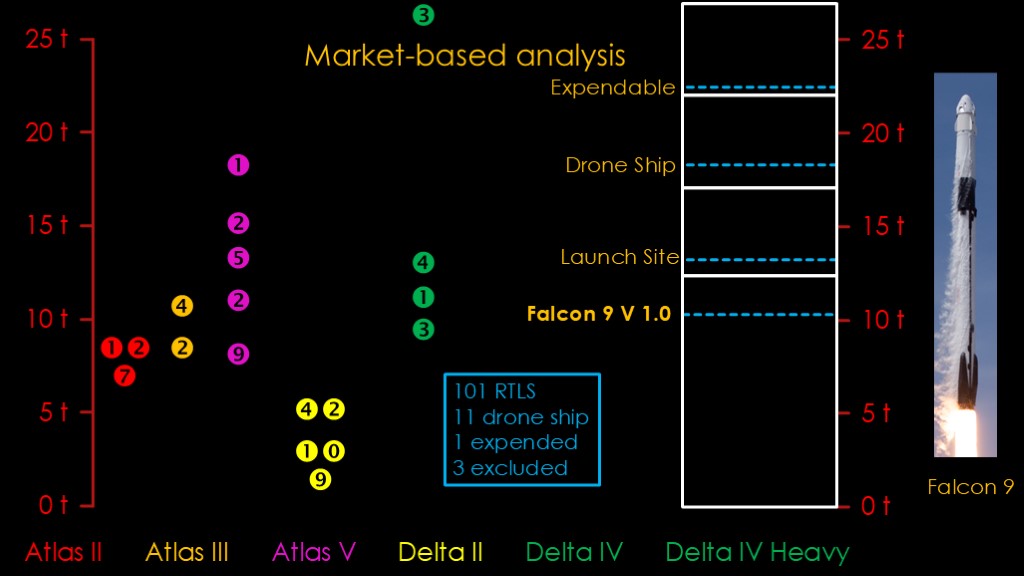
Here's the current Falcon 9 with its payload capabilities in expended, drone ship, and return to launch site modes. It's a little unfair to use these numbers because they are the mature Falcon 9, but the Falcon 9 in 2017 - when reuse got moving - was relatively close.
We'll fly the ULA launches over to the Falcon 9 side
Because I'm looking at launches to low earth orbit and the ULA rockets do a bit better on higher energy launches, I'm going to draw some boundaries that are lower than the actual Falcon 9 payloads. This also adjusts for the early Falcon 9s being less performant than the current one.
All of the Atlas II, atlas III, and delta II payloads plus 15 from Atlas V and Delta IV can be handled by falcon 9 in return to launch site mode, for 101 launches total. 11 further flights require a drone ship landing. One flight cannot be flown reusably and requires an expendable launch. And three missions require another rocket.
For 112 out of 116 launches or 96% the Falcon 9 has sufficient margin to put the payload in the proper orbit in one of the reusable modes. On these flights there is no penalty for reusability. The evaluation is not $ per kilogram, it is whether you can put a customer's payload into orbit.
Note that this is only possible because Falcon 9 is well-sized for these launches and has the margin it needs. If we look at Falcon 9 Version 1.0, we see that it can only launch 78% in fully expended mode and would be able to do less in reusable mode.
We could do the same analysis for communications satellite launches, looking at the actual Falcon 9 flights, and we'd find that many of them can be launched in drone ship mode but some need an expendable launch.
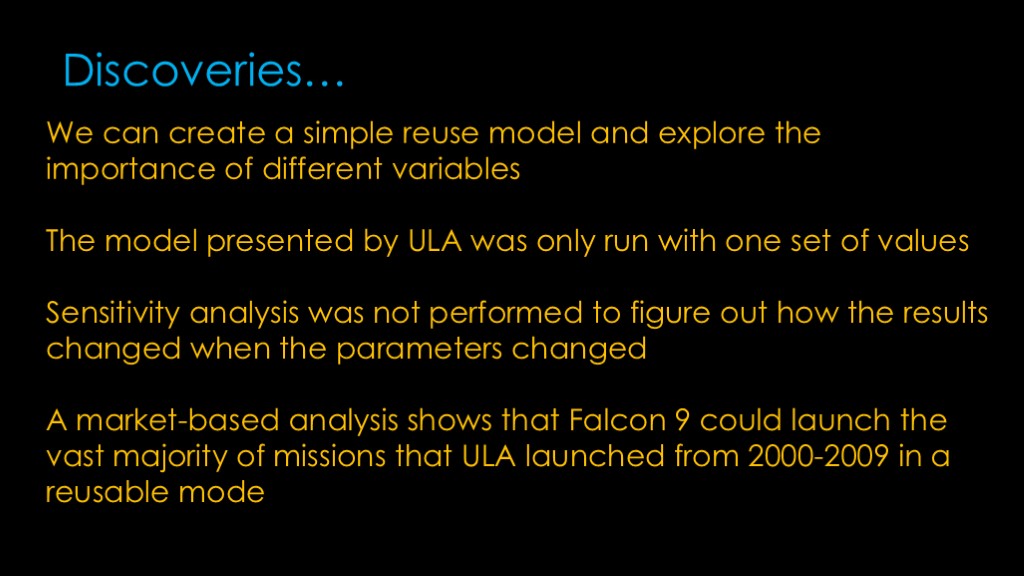
What have we discovered?
That's the end of part 2.
What do you think of this paper and the famous graph? Leave your opinion in the comments.

If you enjoyed this video, buy this print